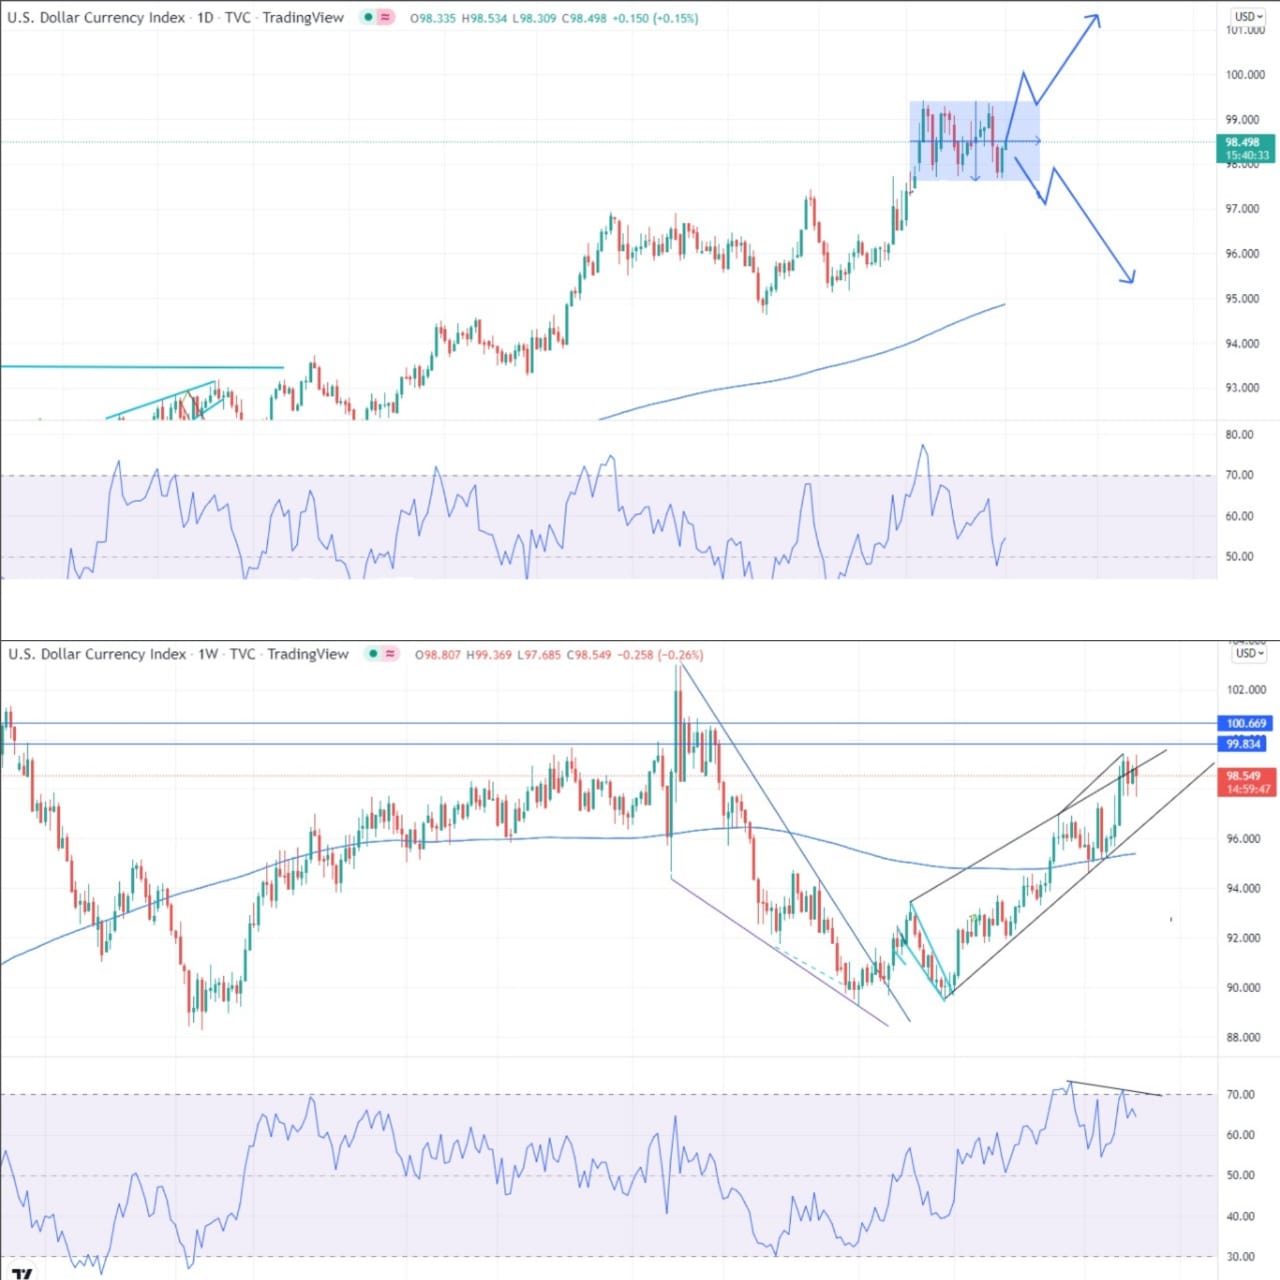
DXY nearing clusters of resistances in medium to long-term (1st April, 2022)
- :
Attached chart is DXY daily and weekly. above part of the chart, daily, is clearly forming the box range trading, a breakout of the range either side will suggest the future direction. Now let’s pay attention to the lower part weekly DXY chart, it suggests some interesting patterns which can be utilized. first it’s been working in the rising wedge so far and at the upper line of the wedge it’s been consolidating for weeks now & that’s the daily chart ranging at above part of the image. Now weekly holding the wedge so far with the negative RSI divergence suggesting the impending reversal. So, look for the medium term to change the direction and time the entry when the daily box range is broken downwards. If the range breaks downwards the probability of downward move will be significant, if the range breaks upwards then long term resistances are there ( check the horizontal blue line ). So, chances of DXY coming down are quite handsome with proper money management techniques.
DXY can come towards 95.400.

