aud/cad medium term buying setup (12th October, 2022)
- :
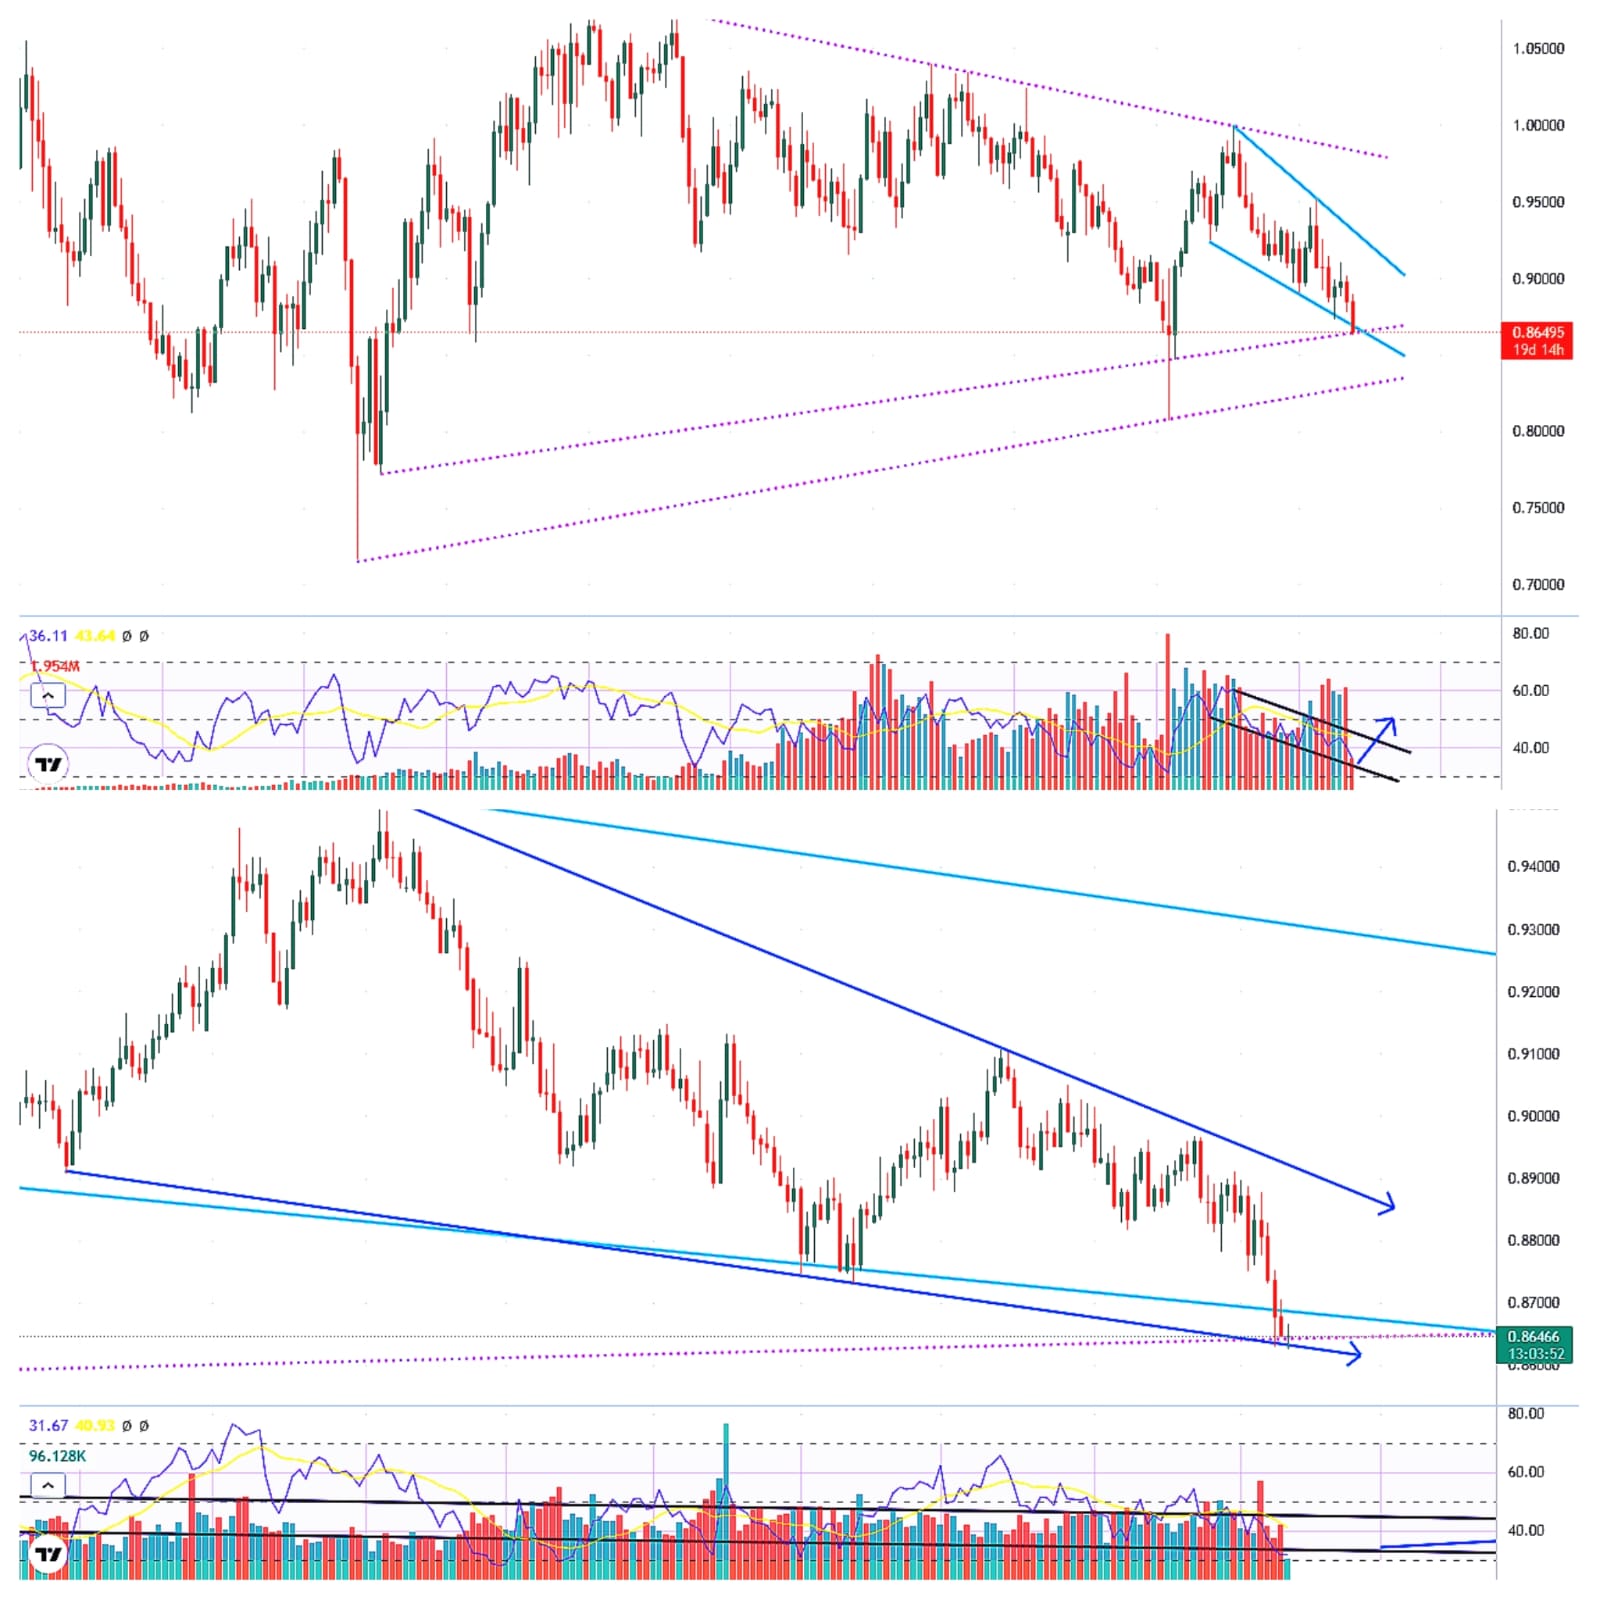
attached is the chart of aud/cad monthly (upper panel) & daily (lower panel).
Rationale :
Technical View:
- aud/cad monthly (upper panel) has been forming longer term symmetrical triangle shown by purple dotted parallel lines. There are 2 dotted lines in support area of symmetrical triangle ( one with considering wicks & one without considering wicks).
- Most recent price action forming falling wedge presented by light blue lines near the support of without wicks symmetrical triangle & forming the confluence area.
- The RSI is also working inside falling channel near oversold areas looking to bounce back towards neutral trajectory of 50 & above.
- aud/cad daily (lower panel) has been forming falling wedge represented by 2 dark blue parallel arrows coming to support of the wedge and looking to gain some ground from here.
Fundamental View :
fundamental view is very complex and will be given to only subscribers.
Plan :
Buy the pair between .86200-.85800 for the target of .90000-.92000
follow us on twitter @marketcrafts
Thank you
Sanjay Galani, CMT, CFTe

