complex longer term set ups in gbp/usd coming to crucial supports (25th September, 2022)
- :
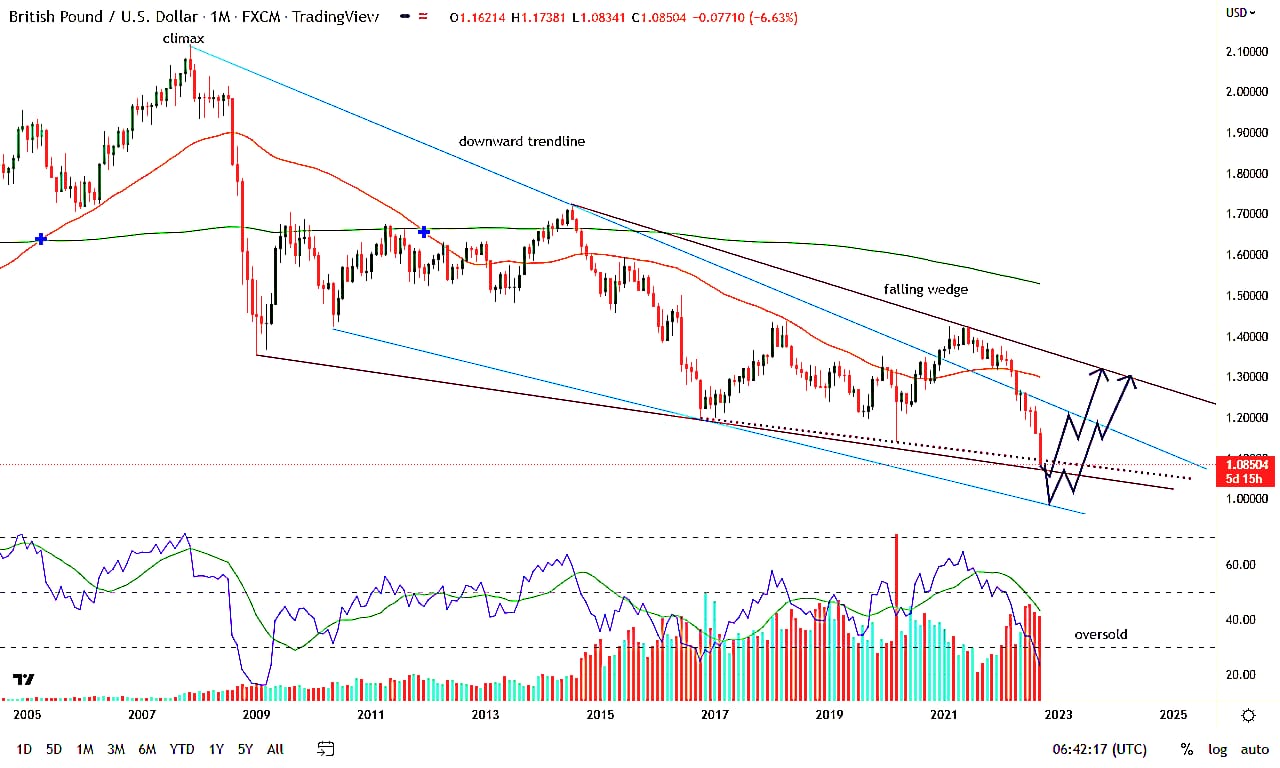
attached is the chart of gbp/usd monthly :

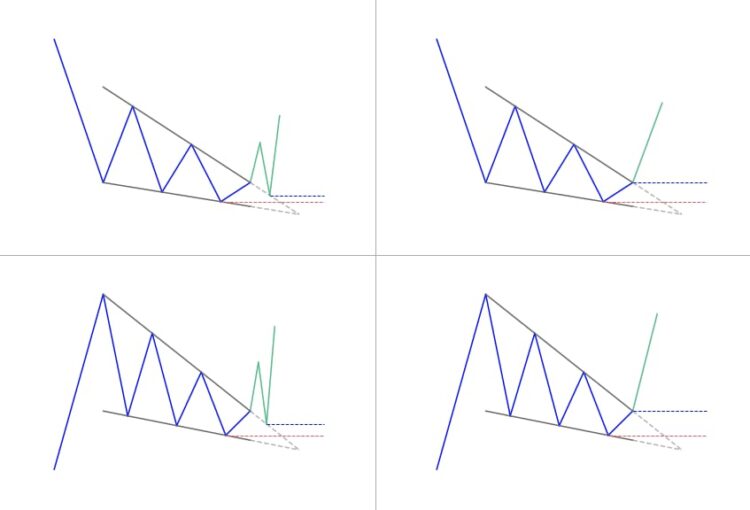
the patterns drawn above are for the understanding of how the falling wedge works. success ratio of falling wedge breaking higher is 89% according to the study done by bulkowski in his chart patterns over multi decades.
Technical View :
gbp/usd has been in the longer term downtrend since 2007 evident by the falling resistance line (blue) keeping the pair under pressure.
through 2009 and 2014 the pair has started forming falling wedge (light red parallel lines) & most recent fall in the pair is coming to the support of the falling wedge near 1.06400.
if that level is taken to the downside and no bounce comes then prices can go to the parity shown by the blue line in support are {you can see the levels by looking at the arrows (path) shown.}
monthly RSI is in oversold territory and showing no signs of relief as of now as price can still fell 200 more pips to 1.06400.
the pair has been under pressure since the brexit & never really moved on from that. Then Russian invasion of Ukrain & Britian’s active participation in aggressive sanctions weigh on the pound.
recent historic tax cuts from UK since 1972 came in on Friday & pair got hit 400 pips & now coming to support areas.
PLAN : we are looking to accumulate the pair between 1.06500-1.02000 (if comes) for the multiyear target of 1.30000.
***please do hold the position for longer term***
Thank you,
Sanjay Galani , CMT, CFTe

