

dxy (dollar index) confirming the correction view, posted previously (14th July,2022)
- :
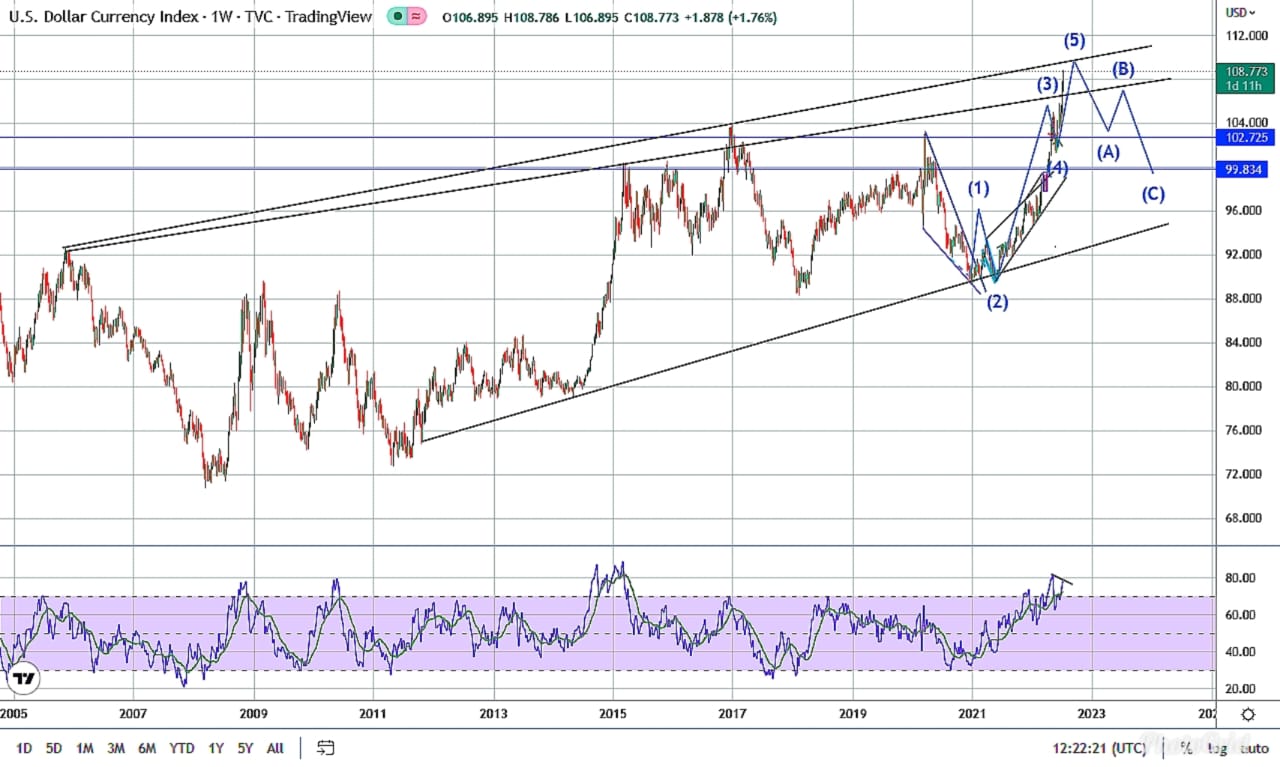
attached is the weekly chart of dollar index,DXY.
Rationale:
Technical View:
- dxy has been working inside long term rising wedge & somewhat rising channel, which is currently heading towards the resistance of the said wedge & channel & gearing up for some correction from the way overbought areas.
- as shown in the chart dxy is about to complete 5th wave on the resistance of wedge and channel giving higher probability of correction considering confluence of technicals. correcting wave ABC can go up to 100.600 dxy, that is 800 pips down.
- recently look at the RSI in the downwards panel, clearly shows the negative divergence is forming & should correct from here on.
Fundamental View:
after the latest CPI & PPI data shows overheating inflation & to curb the inflation the odds of historic 100bps rate hike from the FED were increasing rapidly. But yesterday after the speech of FED’s Waller & Bostic, it was clear that Fed will go for 75 bps & try to avoid rising recession signs by not tightening very aggressively.
the trend of unemployment claims has been surprisingly rising since last month, even though unemployment rate is on historic lows, that can pressure the Fed not to be that aggressive in their approach & keep the long term rates near neutral of 2.75-3.00 %.
the chatter of cutting rates is already picking up speed in Q1 of 2023 which before was expected n Q1 of 2024, which suggests Fed will give up sooner or later from aggressive tightening of monetary policy.
*** special consideration should be taken on tomorrow’s Retail Sales data release to see the consumer spending as US is consumer driven economy***
Plan:
sell the dxy between 109.250-109.750 for the targets of 103.80 & 100.600
Thank you
Sanjay Galani, CFTe
@marketcrafts