

attached is the chart of gbp/usd monthly : the patterns drawn above are for the understanding of how the falling

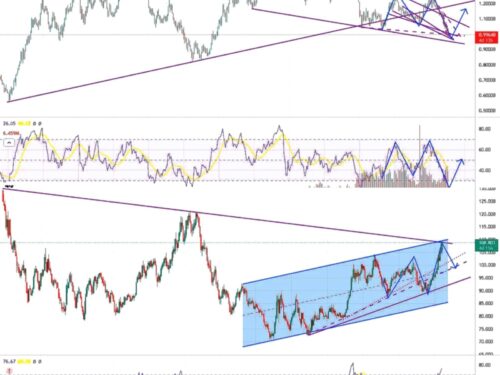
attached is the chart of eur/cad, daily & 4 hourly. Rationale: Technical View: above is the daily eur/cad pair chart,
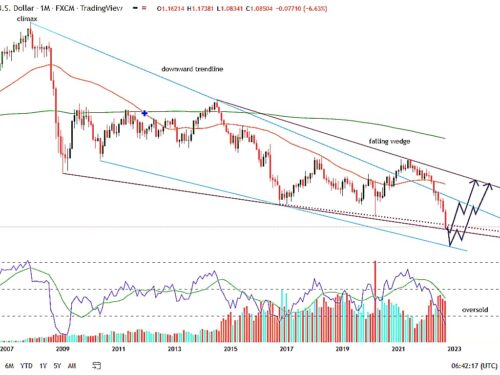
attached is the chart of eur/usd (above panel) monthly & dollar index ,dxy, (below panel) monthly. RATIONALE: Technical View: first
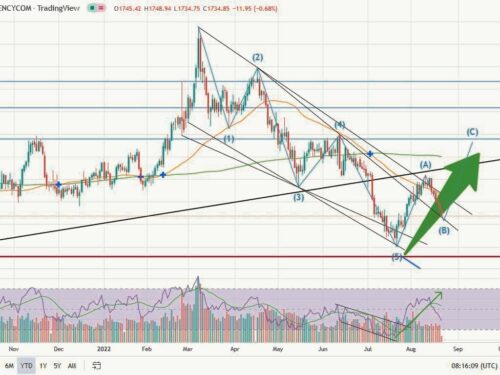
please check our previous analysis of 16th July,2022 regarding Gold with this current analysis of pyramiding into the position. Attached
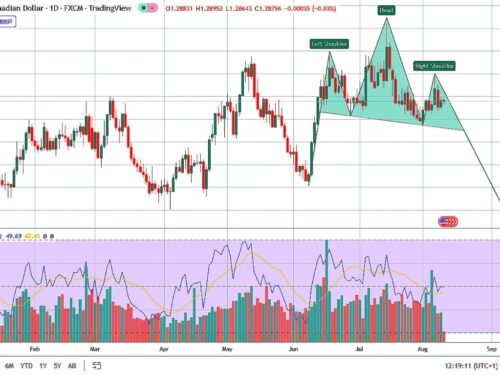
attached is the chart of usd/cad daily. Rationale: after hitting the high above 1.32000 in mid july , usd/cad has
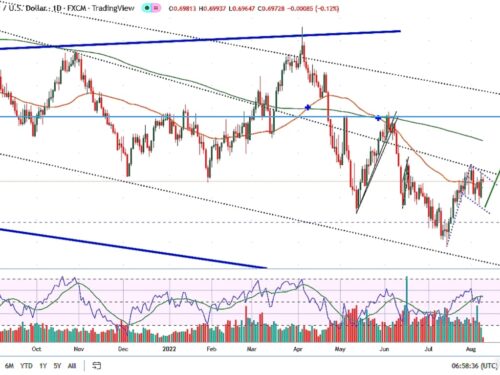
attached is the daily chart of aud/usd. Rationale: Technical View: aud/usd has been working inside the falling wedge & falling