

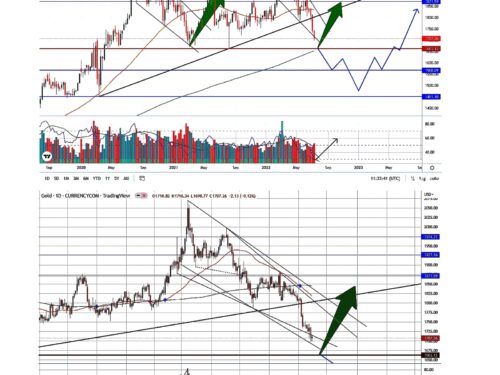
attached is the chart of gold Weekly (upper panel) & daily (middle panel) Technical View: ( Weekly), after hitting the
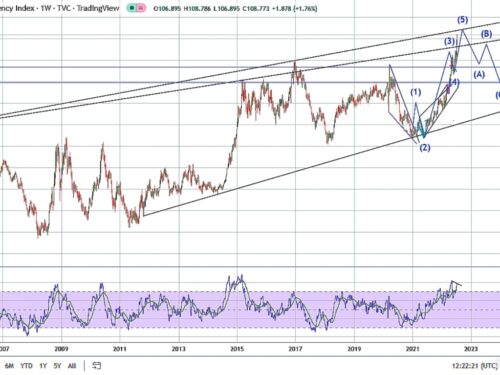
attached is the weekly chart of dollar index,DXY. Rationale: Technical View: dxy has been working inside long term rising wedge

attached is the daily dxy, dollar index, chart. Rationale: Technical View: dxy has been working inside the rising channel since
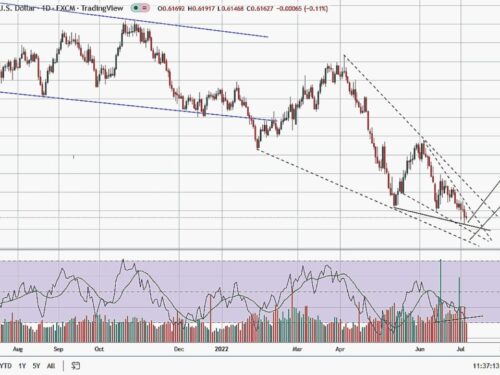
attached is the chart of nzd/usd (New Zealand dollar) daily. Rationale : Technical View :- 1.nzd/usd has been working inside

attached is the chart of silver weekly. weekly flag pattern is evident since the top formed on 1st Feb2022 &
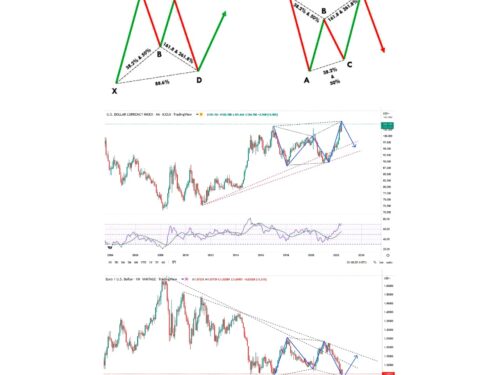
Attached is the chart of DXY (dollar index) & EUR/USD Monthly time frames with general Bat pattern for understanding. Technical