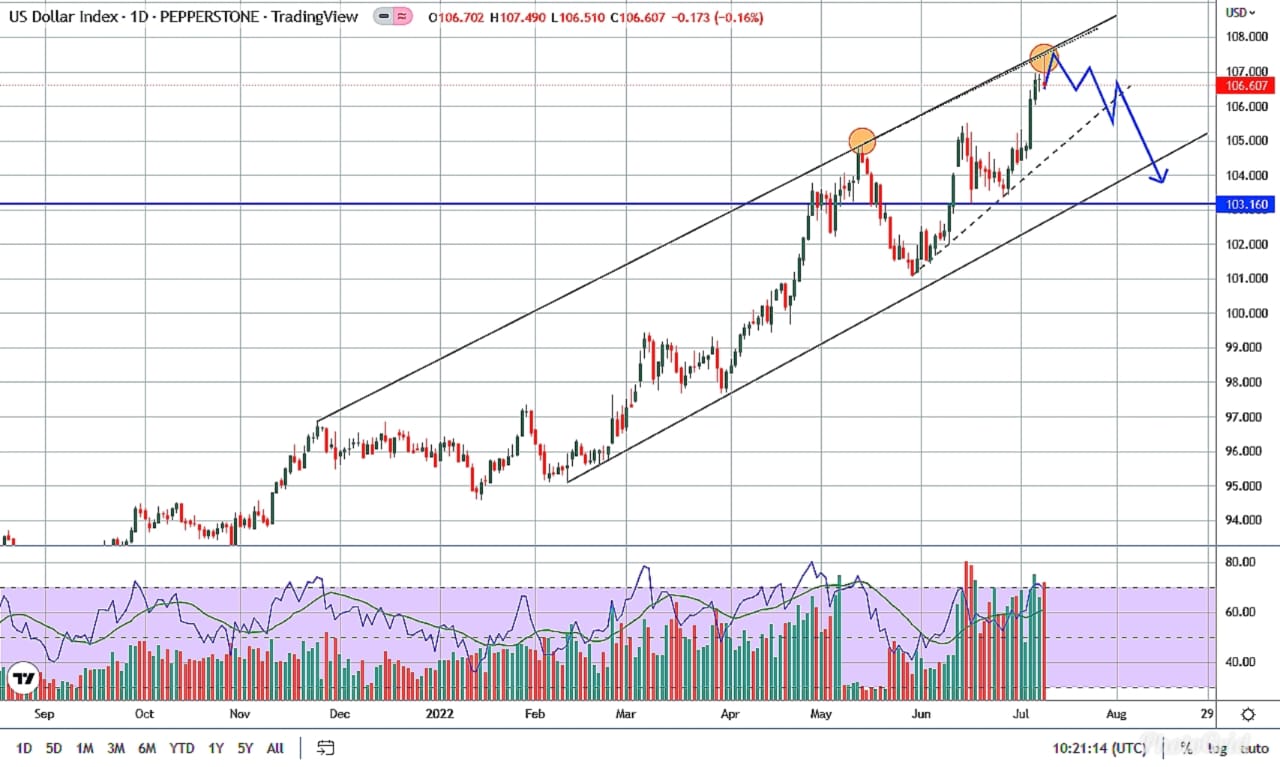
$DXY (dollar index) coming to short term resistances (10th July,2022)
- :
attached is the daily dxy, dollar index, chart.
Rationale:
Technical View:
- dxy has been working inside the rising channel since mid January,2022 evident from long black parallel line & has come to the resistance of the most recent move, touching the resistance of channel.
- In the near term dxy is forming the rising wedge inside the medium term rising channel with the nice probability of breaking downward to the 104 area.
- dxy is rising with the lower or steady volume. On the multi years high if the thrusting of volume is not coming , this shows the rally without the much fireworks that is needed & look at the circles marked, the most recent one is showing the shooting star on the resistance line (much needed confirmation for short term down).
Fundamental View:
- Last week nor-farm payrolls & unemployment data came very hot suggesting USD should up, but as we saw dxy going down because market has been pricing in another 75 bps hike from fed and already dxy hit the high of 107.500 & priced in already. eur/usd also had some support near parity 1.00352.
- ECB is expected to hike at least by 50bps in July or September and overall 100bps till this december. This will put pressure on dxy as eur/usd is 57.8% of dxy.
There are some hidden reasons that will be given to only the subscribers of *marketcrafts.co.in*
Plan:
Sell the dxy 107.200-107.800 for the tgt of 104-103.260.
***special consideration should be taken if Russia stops gas supply to Germany & other EU countries***
That’s where WE ,marketcrafts.co.in* kick in to help you diversify and hedge against other currencies.
Sanjay Galani,CFTe
@marketcrafts

